
Study Parameters
Studies present a single yes/no question to participants on cards which can contain a title, image, description, and price which can be varied to explore their effects. Select up to 40 total question attributes and participant demographics to identify features with real predictive importance for positive responses. Only participants with predefined characteristics are permitted to participate, ensuring that the study aligns with the target audience. Via the Linesol mobile app, participants answer questions (min. 10 seconds) receiving $0.05 per response ($18 per hour), fostering high quality data for actionable insights.
Question Card Features
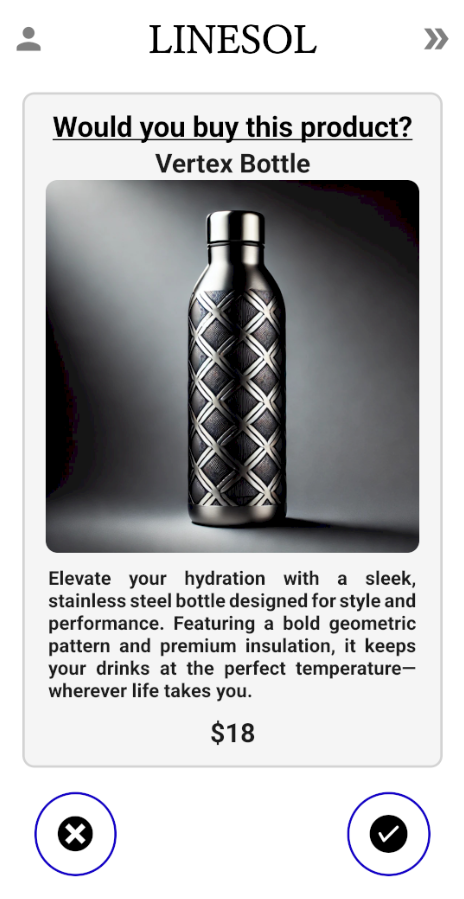
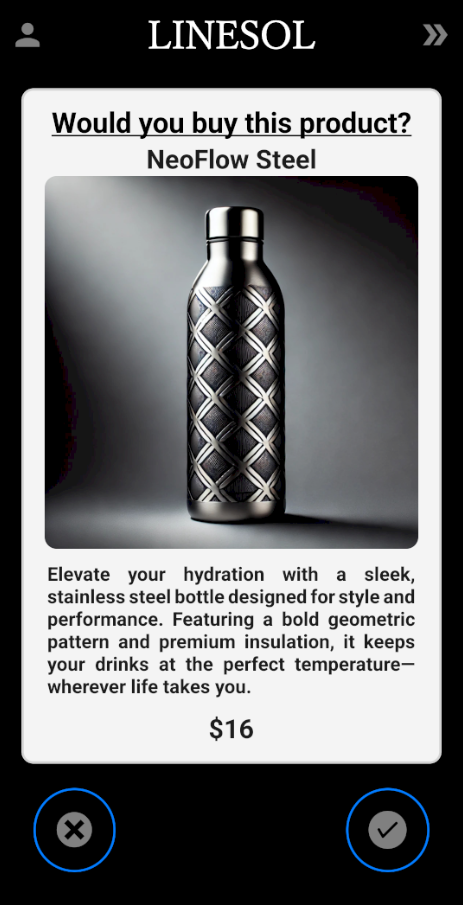
Define a yes/no question like 'Would you buy this product?' and enhance it with question card features such as Titles, Images, Descriptions, and Prices. This approach enables the exploration of how different design elements (such as various images showing different designs) impact the likelihood of positive responses. Each participant responds to one specific configuration, and is collected along with their anonymized user features for analysis.
User Features
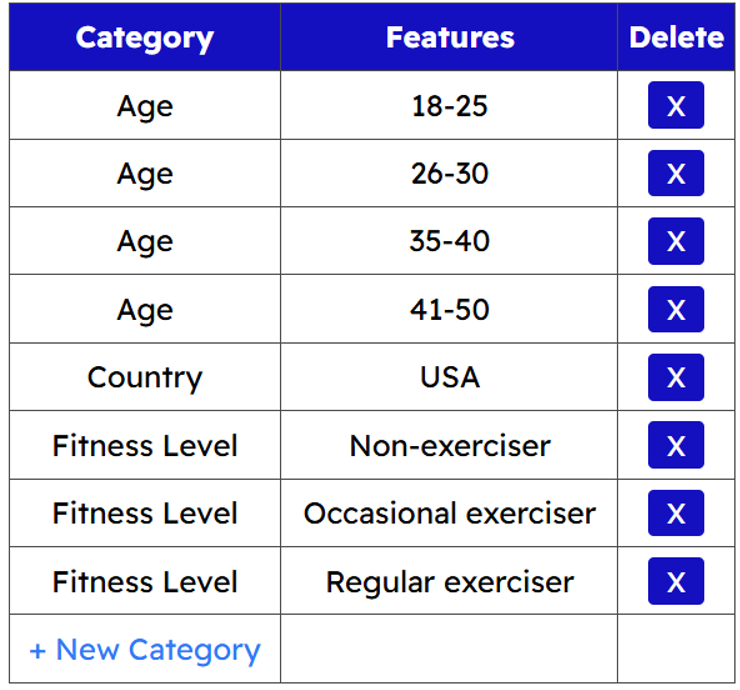
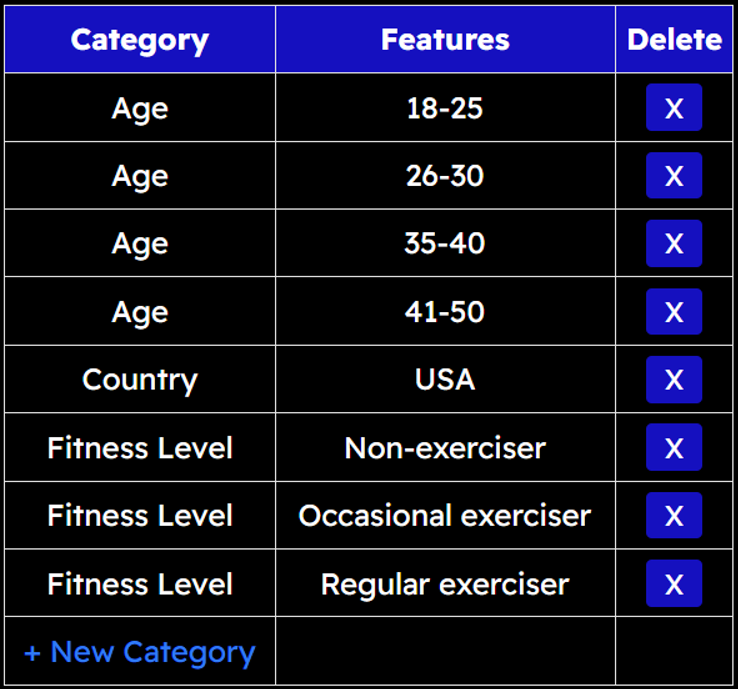
Select from a catalogue of user feature categories, such as age, purchasing behavior, or environmental concern. Existing categories can be browsed alongside live demographic summaries of the participant base, helping you understand how each feature is represented before including it in a study. For each category, a set of categorical features can be selected for analysis. These selections define the participant demographic for the study, ensuring that only users with compatible characteristics are eligible to participate. If a relevant feature is not available in the catalogue, new user features can be submitted as category, feature pairs or as composite (latent) variables. By incorporating multiple user features, the study ranks these characteristics (along with question card features) to understand how they influence the likelihood of a positive response to the question.
Results
Data Analysis
Unlock insights through a fully automated, machine-learning data analysis pipeline that ranks the features most strongly associated with a positive response, grouped by their net positive or negative effect. The analysis also includes price optimization and recommendations for improving future studies. After a study completes, the results include the full raw dataset (CSV), structured study results (CSV), and a detailed analytical report (PDF). This provides immediate insights while allowing full transparency for independent analysis. Live participant demographics, study launches, and results are accessible via the dashboard and the API.
Impact of Question Card Features
- Explore how variations in question card features, including price, title, description, and image, influence the likelihood of positive responses.

Optimal Price Determination
- Identify the optimal price point to maximize revenue per product view by inputting a range of prices in the question card features.

Impact of User Features
- Discover how variations in user characteristics impact the likelihood of positive responses. This analysis offers valuable insights into demographic behaviors, empowering refined marketing strategies and optimized resource allocation for maximum effectiveness.

Suggested Improvements
- Review multicollinearity results and apply dimensionality-reduction techniques to refine feature selection, improving model stability, interpretability, and predictive accuracy.
Use Cases
This powerful and scalable flexibility allows for the deployment of a wide range of applications, each delivering actionable insights tailored to your needs. Whether you're running an A/B Monadic Test, Pre-Roll Test, Conjoint Study, Key Driver Analysis, Price Sensitivity assessment, Segmentation model, or even a Single Implicit Test - we deliver results at just $0.10 per participant. Explore the examples below to see how these use cases are implemented and discover how they can be adapted to your usecase.
- Psychology
- Economics
- Sociology
- Anthropology
- Communications
- Product Appeal
- Slogan Effectiveness
- Campaign Relevance
- Product Positioning
- User Interface Design
- Response Evaluation
- Image Evaluation
- Engagement Appeal
- Bias Detection
- Content Relevance